Vegetables
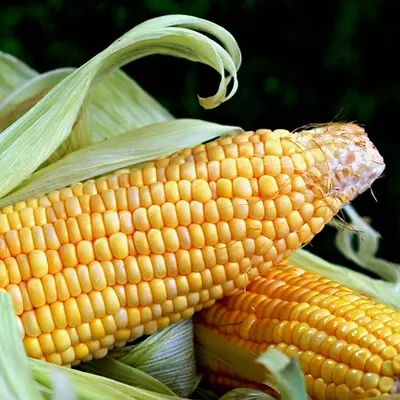
Sweet corn, raw
Per 100 g
- Calories
- 89 kcal
- Protein
- 3.6 g
- Fiber
- 3 g
- Fat
- 1.7 g
Medium fat 16% of its calories come from fat. Our scale
All nutrients
Per 100 g of sweet corn, raw. % Daily Value is for an adult, US FDA values.
Macronutrients
| Nutrient | Per 100 g | % DV |
|---|---|---|
| Carbohydrates | 17 g | 6% |
| Protein | 3.6 g | 7% |
| Fat | 1.7 g | 2% |
| Water | 77 g |
Carbohydrates
| Nutrient | Per 100 g | % DV |
|---|---|---|
| Fiber | 3 g | 11% |
| Sugars | 8 g |
Fats
| Nutrient | Per 100 g | % DV |
|---|---|---|
| Saturated fat | 0.26 g | 1% |
| Monounsaturated fat | 0.49 g | |
| Polyunsaturated fat | 0.54 g | |
| Omega 3 | 0.02 g | |
| Omega 6 | 0.53 g | |
| Cholesterol | 0 mg | 0% |
Vitamins
| Nutrient | Per 100 g | % DV |
|---|---|---|
| Vitamin A (RAE) | 4 µg | 0% |
| Vitamin C | 8 mg | 9% |
| Vitamin D | 0 µg | 0% |
| Vitamin E | 0.3 mg | 2% |
| Vitamin K1 | 1 µg | 1% |
| Thiamin (B1) | 0.15 mg | 13% |
| Riboflavin (B2) | 0.1 mg | 8% |
| Niacin (B3) | 2.3 mg | 14% |
| Pantothenic acid (B5) | 0.58 mg | 12% |
| Vitamin B6 | 0.14 mg | 8% |
| Folate (DFE) | 95 µg | 24% |
| Vitamin B12 | 0 µg | 0% |
Linked nutrients open a table that ranks plant foods by that nutrient.
How we label fat
Our own scale, stricter than official labels: a food with less than 10% of its calories from fat is labelled Low fat, 10% to under 20% Medium fat, 20% or more High fat. The label describes how the food's calories are made up; official US and UK labels use other limits.
More vegetables
 Spaghetti squash
 Frozen corn kernels
 Poblano pepper
 Dried chrysanthemum petals
 Endive
 Alfalfa sprouts
- Fresh wasabi root
 Alfalfa seeds, sprouted, raw
All vegetables · All ingredients
Source
Standard Tables of Food Composition in Japan, 8th revised edition, 2023 supplement (MEXT): Corn, sweet corn, immature kernels, raw ((とうもろこし類) スイートコーン 未熟種子 生), food code 06175. Source: Standard Tables of Food Composition in Japan (Eighth Revised Edition), 2023 supplement, Ministry of Education, Culture, Sports, Science and Technology (MEXT), data updated 27 March 2026; English names from MEXT's 2015 English edition. Values edited by us (units and totals). MEXT website terms of use (Government Standard Terms of Use, compatible with CC BY 4.0). The table. Protein (nitrogen x factor), total lipid and carbohydrate by difference, as USDA measures them; sugars are the sum of the sugars in the carbohydrate tables. Daily Values: US FDA, 21 CFR 101.9.